We've done a lot of research into our packaging materials in order to assure ourselves (and our customers) that we have the best solution for shipping our honey, based on safety and environmental suitability.
Dan's is a bit of science nerd at heart and with Linda being a Doctor, we wanted to make sure we were making the overall best decisions for our honey.
Initially we were glass fans, we bought into the fact that plastic was a dirty word, was less recycled and glass gave a better, more premium experience overall.
But once we dug below the surface, the glass argument started to become less clear cut and logical.
We have put some of the facts we have discovered to explain why below...
PET vs Glass - Environment

energy
The Manufacturing of PET jars products 1/6 the carbon footprint of Glass jars
Shipping
The shipping of a full PET honey jar, produces 1/2 the CO2 of shipping a full glass jar
Total Life Cycle
Overall life cycle assessment of PET jars is between 1/4 to 1/5 of the carbon footprint of glass
Recyclability
PET recycling is actually more common/accessible in the markets we sell to
energy
The Manufacturing of PET jars products 1/6 the carbon footprint of Glass jars
Shipping
The shipping of a full PET honey jar, produces 1/2 the CO2 of shipping a full glass jar

Total Life Cycle
Overall life cycle assessment of PET jars is between 1/4 to 1/5 of the carbon footprint of glass
Recyclability
PET recycling is actually more common/accessible in the markets we sell to
PET vs Glass - Safety & Quality
Yes PET is still a plastic and as such it is comes with a certain dark shadow over it. However again, we wanted to fact check some of what we have heard as discussion points with friends and customers, to really distill what is the truth.
We have created a comparison table below of the different type of food grade storage options below and how they compare with each other in terms of key health concerns
Wonder Honey PET
Glass
HDPE
PP
PVC
Chemically Inert
Exhibits Endocrine Activity
BPA &BPS Free
Phthalate Free
PFAS Free
As you can see both Glass and PET are equals when it comes to comparison as they are the two most safest type of food packaging.
While PVC comes out the worst.
If you want to learn more and view the research on PET and how it compares to other plastics then please click on the button below

However Regarding Glass
We have to also consider the lids and the process the honey goes under
Packing Honey in Glass
Packing large volumes of honey in glass usually means two things
- The honey is heated
- PVC seals are used
We will describe below why this creates a major issue if you are trying to sell high quality Manuka
Honey is Usually Heated to High Temperatures
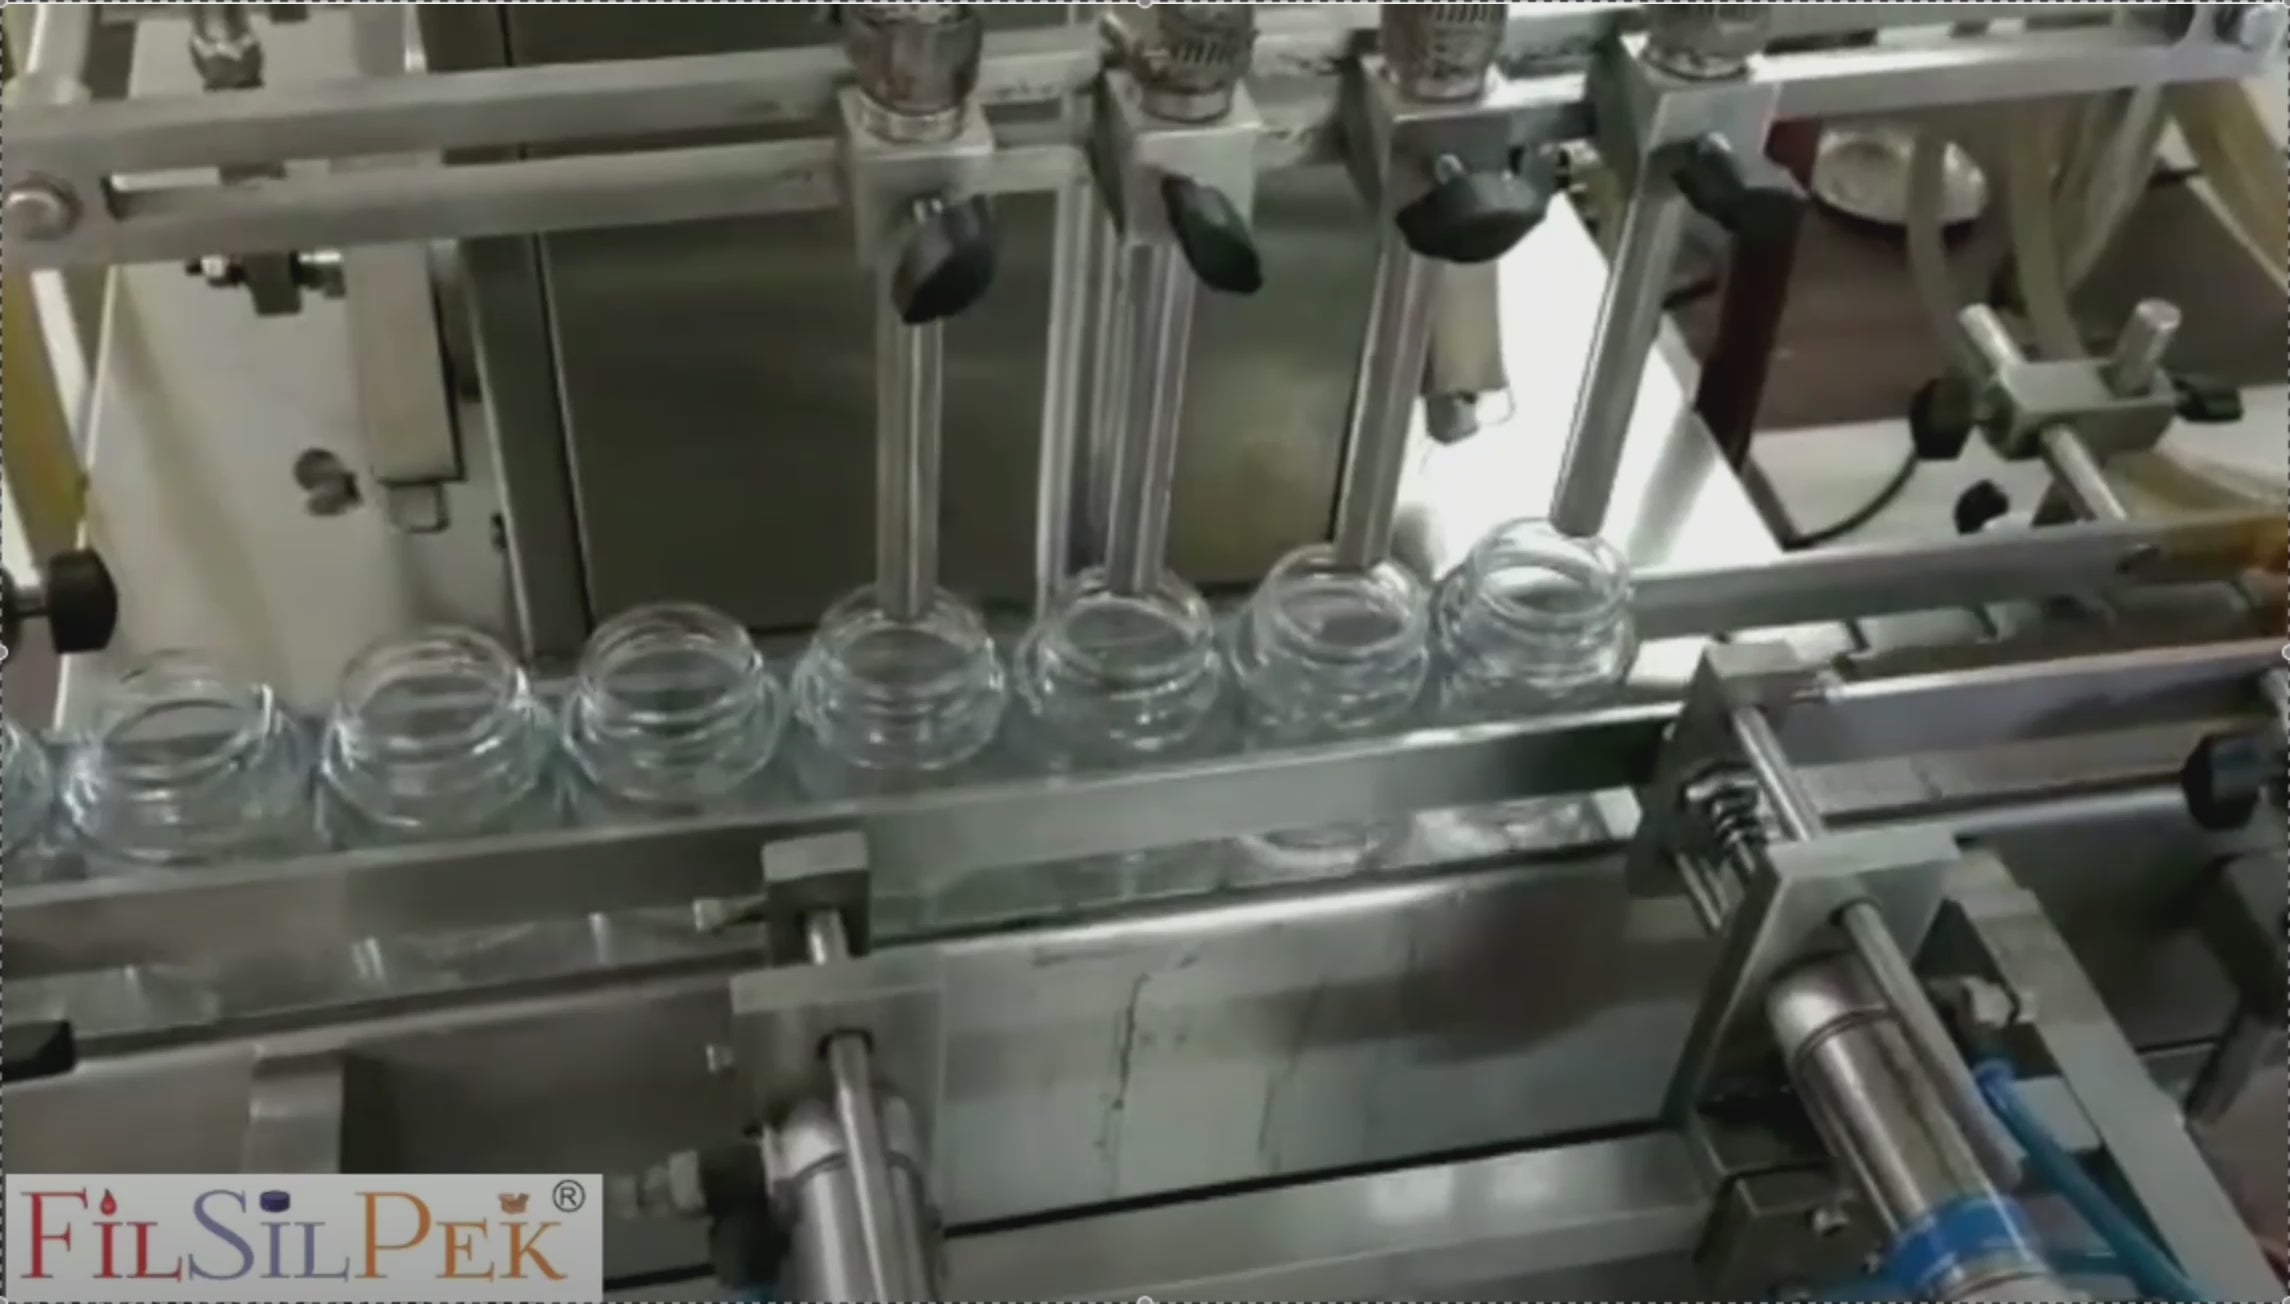
Most honey that is packed into jars is heated (hot filled) as per the process below
Hot Fill Process for Honey in Glass Jars:
- Heating – Honey is typically heated to around 50–60°C (122–140°F) to reduce viscosity, making it easier to fill and ensuring proper sealing.
- Filling – The warmed, liquid honey is poured into glass jars.
- Capping – The jar is immediately sealed while the honey is still warm.
- Cooling – As the honey cools, it creates a slight vacuum inside the jar, vacuum sealing the jar and extending shelf life.
So why hot fill honey jars?
✅ Prevents crystallization – Heating reduces the likelihood of premature crystallization.
✅ Easier and faster filling – Warm honey flows better, preventing air bubbles and inconsistencies.
✅ Sterilization – Helps kill potential yeast and bacteria, improving shelf life.
✅ Better sealing – Creates a vacuum seal in glass jars, preventing leaks and spoilage
Why is this bad?
High heat damages the honey's nutrient profile, temperatures over 40C (104 F) destroy the enzymes, and heat can destroy the peroxide activity in the honey making it less active
PVC Seals Are Used
Honey packed in glass jars undergo a different sealing process as induction seals do not work on glass. In honey packed in glass - the lids used are usually metal, with the inside of the lid being coated in a substance call Plastisol
Plastisol is the name for PVC substance that acts as a rubbery gasket to seal over glass.
You will recognise this if you lift up the lid of a mason jar and have a look at the rubbered side - in most cases that is plastisol
The problems with Plastisol are two fold
It is made of 2 highly toxic plastic components
The key components of plastisol are...
PVC Resin – The solid polymer that forms the base of plastisol. PVC (Polyvinyl Chloride) is a rigid polymer on its own but becomes flexible when combined with plasticizers. PVC is a highly toxic form of plastic, with high leaching probability and exhibits high endocrine disruption activity. It is the most toxic form of plastic studied in the research article below.
Plasticizers – This is the liquid component (phthalates, adipates, and other compounds) that softens and makes the PVC resin flexible. The amount and type of plasticizer affect the consistency and performance of the plastisol. Phthalates are known to interfere with the body's hormonal system, and are also know to reduce fertility and can also interfere with fetal development. The are also considered an obesogen.
It can erode quickly
Plastisol needs to be stored under strict conditions, and especially away from UV light and higher humidity which can make the substance brittle. Overtightening the lid can also lead to seal erosion. Seals are typically have a shelf life of 2 years or less.
The chances of the seal deteriorating even at a microscopic level, means there is a risk for contamination of PVC particles and hopefully if you have read the above you will understand the PVC is the most highly toxic form of plastic.
Health Concerns with Glass Jars and Plastisol Liners
Chemical Leaching from Plastisol Liners: Studies have found that foods in glass jars sealed with polyvinyl chloride (PVC) gaskets, a component of plastisol, contained di(2-ethylhexyl)phthalate (DEHP) at levels deemed unacceptable by health authorities.
Advantages of PET Jars
1. Cold Filling Process: PET jars allow for a cold filling process, eliminating the need to heat honey. This method preserves the natural enzymes, antioxidants, and antibacterial properties of honey, ensuring consumers receive its full health benefits.
2. Reduced Risk of Chemical Contamination: High-quality, food-grade PET is designed to be safe for food contact, with stringent regulations ensuring it doesn’t leach harmful substances into the product. This reduces the risk of chemical contamination compared to plastisol liners in glass jar lids.
Conclusion
While glass jars have been a popular choice for honey packaging, the potential health risks associated with plastisol liners and the hot filling process are significant considerations. PET jars, with their ability to preserve the natural qualities of honey through cold filling and their reduced risk of chemical contamination, gives us a compelling alternative.
Our Jars are
